Common Restaurant Complaints: What 2,673 Bad Reviews Really Say
The most common restaurant complaints, counted across 2,673 low-star Google reviews: what turns a 3-star into a 1-star, and how to find your own mix.
ReplyOnTheFly Team
Content Team

Every restaurant owner knows what a bad review feels like. Far fewer know what their bad reviews are actually about, because nobody reads two years of them in one sitting. We did, for 246 restaurants, and the mix is not what most owners assume.
Quick answer
Across 2,673 one- to three-star Google reviews, the most common restaurant complaints were food quality (21.6%), waiting and slow service (18.8%), price (18.5%) and rude staff (10.0%). But the themes that turn a three-star review into a one-star review are not about the food: rudeness showed up in 14.6% of one-star reviews and 2.7% of three-star reviews, while food complaints were spread evenly across all three. And the average mix is not yours, because the fleet's top complaint led at only 15 of the 48 restaurants with enough data to tell, so the last section shows how to count your own.
This guide is part of our series on Google review analytics. It is the restaurant-specific companion to analyzing customer reviews for themes, which covers the method for any business.
How We Counted
We took every Google review posted in the 24 months to October 19, 2026 on the 246 restaurant profiles connected to ReplyOnTheFly whose primary category is a restaurant type, with our own test accounts excluded. That is 61,193 reviews.
Of those, 4,967 (8.1%) were three stars or fewer. We kept the ones with written text in English, which left 2,673 complaints: 1,523 one-star, 510 two-star and 640 three-star.
The median complaint ran 38 words at one star, 43 at two and 29 at three. The median five-star review ran 15.
We then counted which of thirteen themes each complaint mentioned, using word lists (for example, "overcooked", "bland" or "soggy" for food quality; "rude", "ignored" or "attitude" for staff). A complaint can count toward several themes, and most of the interesting ones do. Word lists under-count, never over-count, so treat every figure below as a floor.
| Rating | Share of all reviews | Left written text |
|---|---|---|
| 5 stars | 83.7% | 72.0% |
| 4 stars | 8.2% | 45.3% |
| 3 stars | 2.8% | 54.6% |
| 2 stars | 1.4% | 79.0% |
| 1 star | 3.9% | 82.9% |
One pattern is visible before any theme counting. The angrier the customer, the more they write. Four- and three-star customers, the ones whose meal was nearly right, are the most likely to say nothing at all. That matters later.
The Most Common Restaurant Complaints, Ranked
Here is what the 2,673 written complaints mentioned, most common first.
| Complaint theme | Share of complaints | What the words looked like |
|---|---|---|
| Food quality | 21.6% | bland, overcooked, undercooked, soggy, dry, greasy, mediocre, "nothing special" |
| Waiting and slow service | 18.8% | waited, slow, "took an hour", forever |
| Price and the bill | 18.5% | overpriced, expensive, "not worth", charged, bill |
| Rude or dismissive staff | 10.0% | rude, attitude, ignored, unprofessional, dismissive |
| Manager or owner named | 7.9% | manager, owner, management |
| Delivery, takeout, pickup | 7.4% | delivery, DoorDash, Uber Eats, takeout, "to go", online order |
| Cold food | 7.1% | cold, lukewarm, reheated, "not hot" |
| Wrong or missing order | 6.6% | wrong, missing, forgot, "never came" |
| Cleanliness and restrooms | 6.3% | dirty, sticky, hair, bathroom, smell |
| Seating, reservations, hours | 5.4% | reservation, seated, host, "turned away", hours |
| Portion size | 4.6% | portion, tiny, small, skimpy |
| Noise, parking, comfort | 4.1% | loud, music, cramped, parking, lighting |
| Got sick | 2.4% | sick, food poisoning, stomach |
Three in ten complaints (30.5%) hit two or more themes. The classic shape is the pile-on: the wait was long, then the food came cold, then nobody came to fix it.
Group the themes and a second picture appears. Some service theme (waiting, rudeness, a wrong order, a seating problem or a named manager) appears in 35.8% of complaints. Some food theme (quality, temperature, portions or illness) appears in 30.1%. Food is the biggest single complaint; service, added up, is the bigger category.
The third that matched nothing
32.8% of complaints matched none of the thirteen themes. Reading a sample, they were specific in ways no list predicts: a restaurant that refused cash, a draft system that was down and a kitchen out of spinach on the same night, a sauce left out of a takeout bag, something alive in a bowl, a franchise that was "not what it used to be". These are often the most fixable complaints a restaurant has, and keyword counting never surfaces them. Someone has to read.
That ranking lines up with the one piece of peer-reviewed work on this question. Ioannis Pantelidis's 2010 study in Cornell Hospitality Quarterly coded 2,471 online comments about 300 London restaurants and found diners weigh food first, then service, ambience, price, menu and decor, in that order.
Food leads the mentions. What the study does not show, and our rating split does, is which of those themes decides how low the star goes.
A 3-Star Is About the Food. A 1-Star Is About How You Were Treated
Split the same complaints by star rating and the themes stop being evenly spread.

| Theme | 1-star (1,523) | 2-star (510) | 3-star (640) |
|---|---|---|---|
| Rude or dismissive staff | 14.6% | 5.5% | 2.7% |
| Manager or owner named | 9.8% | 6.9% | 4.4% |
| Any service theme | 40.2% | 35.9% | 25.5% |
| Any food theme | 28.1% | 39.2% | 27.7% |
| Waiting | 19.0% | 22.7% | 15.3% |
| Price | 17.5% | 26.5% | 14.5% |
| Two or more themes | 31.7% | 35.7% | 23.4% |
| Praised the food anyway | 7.6% | 13.7% | 17.2% |
Read the first two rows. Rudeness is more than five times as common in a one-star review as in a three-star one. A named manager or owner is more than twice as common. Food complaints, by contrast, sit at 28% in both the one-star and three-star columns.
So the food is rarely what makes a review a one-star. Something going wrong with the meal produces a three-star review. Something going wrong with the meal, followed by a server who shrugged or a manager who argued, produces a one-star review.
The second half of that sequence is the part you can train.
Two-star reviews are their own animal: the highest shares for food problems, price and waiting, and the most pile-ons. These are the customers who had a genuinely bad meal but were treated decently enough to stop short of one star.
Reply to the complaint, not the star
Paste any restaurant review and get a reply that names the actual problem, with no canned AI phrasing. Free, no signup.
Try the Free Response GeneratorThe bottom row is worth a second look. 17.2% of three-star complaints praised the food in the same breath ("the food was great but the service..."), and 12.3% praised the atmosphere.
These are customers who wanted to like you. They are also, as the next section shows, the ones you are least likely to hear from at all.
The 3-Star Reviews Nobody Reads
Go back to the first table. 45% of three-star reviews and 55% of four-star reviews had no text. Those customers gave a rating that pulls your average down and told you nothing about why.

The three-star reviews that do carry words are the most useful complaints a restaurant gets, for three reasons.
- They are the mildest, so they describe the problem rather than the fury.
- They most often come with praise attached, so you can tell what to keep.
- They arrive earliest. The same kitchen slip that earns a three-star review in a quiet week earns a one-star review on a Friday night, when the server has no time to recover it.
Most owners read their one-star reviews because they hurt and skip their three-star reviews because they do not. That is backwards. Our guide to star rating vs sentiment goes deeper on why the middle of the scale carries the signal.
Your Restaurant Is Not the Average
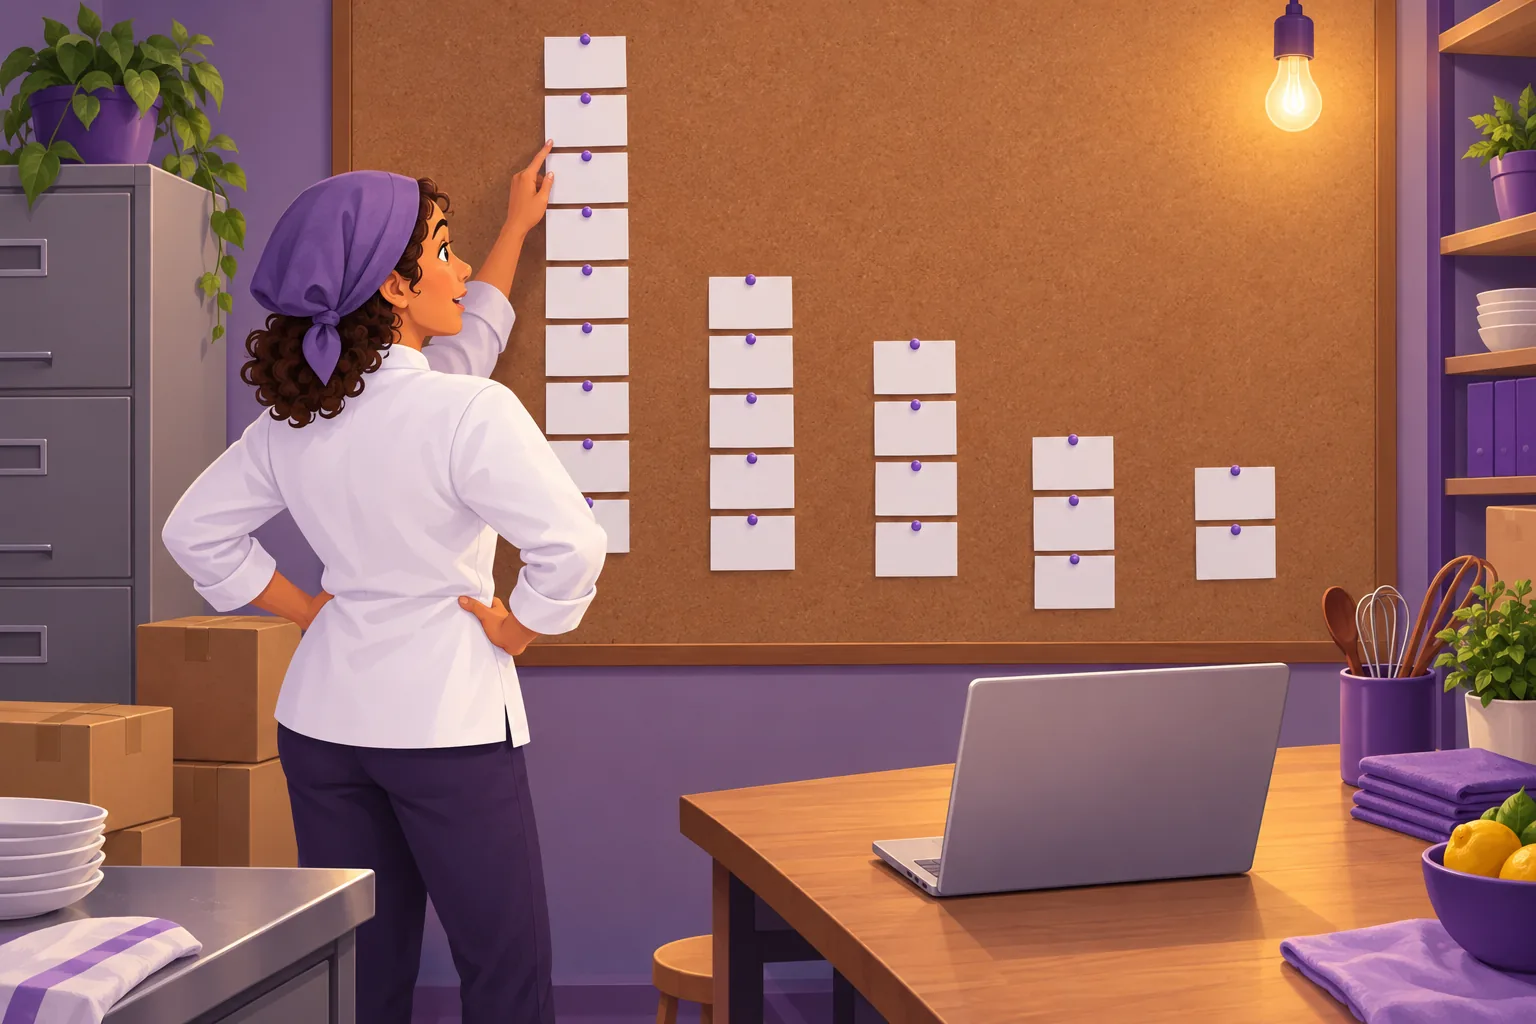
Everything above is a fleet average, and the fleet average is not your restaurant. To check how much it varies, we looked at the 48 restaurants with at least 20 written complaints each (1,674 complaints between them) and asked which theme led at each one.
| Top complaint at the restaurant | Restaurants where it led |
|---|---|
| Price | 18 |
| Waiting | 17 |
| Food quality | 15 |
| Rude staff | 3 |
| Cold food | 2 |
| Delivery and takeout | 1 |
(Ties count for each tied theme, which is why the column adds to more than 48.)
Food quality, the fleet-wide leader, led at fewer than a third of these restaurants. And the share each theme took varied enormously from one restaurant to the next:
- Waiting ranged from 0% of a restaurant's complaints to 65%. At three of the 48, nobody mentioned waiting at all.
- Food quality ranged from 0% to 50%.
- Price ranged from 0% to 51%.
- Rude staff ranged from 0% to 33%. Seven restaurants had no rudeness complaints in two years; the median restaurant had it in about one complaint in eleven.
- Cold food ranged from 0% to 32%, and cleanliness from 0% to 22%, with a dozen restaurants never mentioned for cleanliness once.
A restaurant where 65% of complaints are about waiting has a staffing or ticketing problem and should ignore every article about menu quality. A restaurant where a third of complaints name rudeness has a floor problem and should ignore articles about pricing.
The fleet ranking tells you what to look for. Only your own count tells you what you found.
How to Find Your Own Complaint Mix
You can run the same analysis on your own reviews in under an hour. Here is the manual version.

- Pull every review under four stars from the last twelve months. Our guide to exporting Google reviews covers getting them into a spreadsheet. Twenty complaints is enough to start; the pattern sharpens with more.
- Tally the thirteen themes. Add a column per theme from the table above and tick every one each complaint mentions. Most will tick two.
- Read the ones that tick nothing. Expect about a third. Write a one-line label for each. These are your restaurant's specific problems, and they are usually operational and cheap to fix.
- Split the tally by star rating. Which themes live in your one-star reviews, and which in your three-star reviews? If rudeness or a named manager is concentrated at one star, the fix is on the floor, not in the kitchen.
- Fix the top theme, then re-count in three months. One change, one theme, one re-count. A falling share is the only proof that the fix worked. For the broader method, see how to find patterns in hundreds of reviews.
If you would rather not do the reading, this is the job Review Insights does inside ReplyOnTheFly. It reads your Google reviews, groups them into named positive and negative themes with a mention count for each. It marks every theme as rising, stable or declining against the previous period, flags any negative theme that is new since the last run, and lets you click any theme to see the exact reviews behind it.
It re-runs every week, so the three-month re-count in step 5 happens on its own.
The word lists are a floor, not the truth
A review that says "we sat there for ages with menus closed" is a waiting complaint that no word list catches. The counts in this article are deliberately conservative for that reason. When you do your own tally, read first and tick second, and you will find more than we did.
What to Do With Your Top Theme
The data points at a different first move for each leading theme. None of them is "reply better", though every one of them deserves a reply.
- Waiting leads: look at the ticket times by hour and day before you look at the staff. In our data, waiting complaints cluster at specific restaurants, which means a specific bottleneck, not a slow industry.
- Price leads: the complaint is almost never the number on the menu. It is the gap between the number and the plate. Portion, temperature and a wrong item all read as "overpriced" when the bill arrives.
- Food quality leads: pull the dish names out of the complaints. Three mentions of the same dish is a recipe or a station, not a bad night.
- Rude staff or a named manager leads: this is the one that turns three-star reviews into one-star reviews, and the fix is a script. Decide now what any server says and does when a plate is wrong, so recovery is not left to whoever is most tired.
- Delivery and takeout leads: these complaints usually land on your Google profile even when the failure belonged to the courier app. A packing checklist and a bag seal fix most of them.
Whatever leads, answer the review itself. Because the reaction to a problem is what separates a one-star from a three-star, the public reply is your second chance at that reaction.
Name the specific thing, say what changed, and take refunds offline. Our restaurant review response templates cover every theme in the table, and the guides to wait time complaints, food quality complaints and pricing complaints go deeper on the three biggest.
If the replies themselves are the bottleneck, ReplyOnTheFly watches your profile and emails you each new review with a reply drafted in your restaurant's voice, which you approve in one tap. See how it works for restaurants.
Frequently Asked Questions
What are the most common restaurant complaints?
Across 2,673 one- to three-star Google reviews of 246 restaurants, the most mentioned complaint was food quality (21.6%, words like bland, overcooked, soggy or mediocre), followed by waiting and slow service (18.8%), price and the bill (18.5%), rude or dismissive staff (10.0%), a named manager or owner (7.9%), delivery and takeout problems (7.4%), cold food (7.1%), wrong or missing orders (6.6%) and cleanliness (6.3%). Three in ten complaints raised more than one of these.
Do restaurant customers complain more about food or service?
Food is the single most mentioned theme, but service themes together appear more often. Adding up waiting, rudeness, wrong orders, seating problems and a named manager, some service theme appears in 35.8% of written complaints, against 30.1% for food themes (quality, temperature, portions and illness). The split also changes with the rating: service themes appear in 40.2% of one-star reviews and 25.5% of three-star reviews, while food themes stay close to 28% in both.
What percentage of restaurant Google reviews are negative?
In this data, 8.1% of restaurant reviews were three stars or fewer: 3.9% one-star, 1.4% two-star and 2.8% three-star. Four-star reviews were another 8.2%, and 83.7% were five stars. One-star reviewers almost always explain themselves (82.9% left text), while 45% of three-star reviews and 55% of four-star reviews carried no words at all.
Why do restaurants get one-star reviews instead of three-star reviews?
How the customer was treated after something went wrong. Rude or dismissive staff appeared in 14.6% of one-star reviews but only 2.7% of three-star reviews, and a manager or owner was named in 9.8% of one-star reviews against 4.4% of three-star reviews. Food complaints were spread almost evenly across the ratings. A problem with the meal tends to produce a three-star review; a problem with the meal plus a poor reaction to it produces a one-star review.
How do I find out what my own restaurant's reviews complain about?
Pull every review under four stars from the last year, tick the themes each one mentions, read the ones that match no theme, and split the tally by star rating. Across 48 restaurants with at least 20 written complaints, the fleet-wide leader (food quality) was the top complaint at only 15 of them, so the average mix will not tell you yours. Inside ReplyOnTheFly, Review Insights does this reading automatically: it groups your reviews into named themes with mention counts, marks each as rising or declining, and lets you click a theme to see the reviews behind it.
Should I reply to restaurant complaints on Google?
Yes, and the data suggests how. Because rudeness and a bad reaction from management are what separate a one-star review from a three-star one, the reply is your second chance at the moment that went wrong. Name the specific problem, say what changed, and move anything that needs a refund or a conversation to email or phone. Our restaurant review response templates cover wait times, cold food, pricing and the rest, and the free response generator drafts one in seconds.
The Bottom Line
The most common restaurant complaint is the food, but the food is not what earns the one-star. Rudeness and a bad reaction from management are five times as common in one-star reviews as in three-star ones, and the restaurants with the worst mix of complaints each had their own specific problem, not the industry's.
Count your own. Twenty complaints, thirteen themes, one split by star rating, and you will know whether your problem is the kitchen, the floor or the bag. Then fix one thing and count again.
If you would rather the counting ran itself, start free and every new review arrives in your inbox with a reply already drafted, while Review Insights keeps the tally for you.
Know what your reviews are really saying
Every new Google review emailed to you with a reply already written in your voice, plus the themes behind all of them. Approve in one tap, no login needed, free to start.
Start Free - No Credit Card Required- Unlimited AI drafts
- 5 free one-click posts/month
- Works from your email inbox
Written by ReplyOnTheFly Team
Content Team
Free toolNo signup
Score your profile
Nine real ranking factors checked in about 30 seconds. Letter grade and the specific gaps.
Audit my profileOr create a free account to automate replies
Related Articles

Google Review Analytics: Track Metrics That Drive Business Growth (2026)
Learn how to track and analyze Google review metrics to improve your reputation and revenue. Get actionable insights from review data to grow your business.

Analyze Customer Reviews for Themes: What Sales Data Hides
Sales numbers tell you what happened. Learn how to analyze customer reviews for themes to see why it happened, and catch problems before revenue moves.

How to Find Patterns in Hundreds of Customer Reviews
Once you have hundreds of reviews, the loudest one isn't the most common. Here's how to find patterns in customer reviews at scale, without reading every one.